Ask what changed. Forecast what's next.
When metrics move, you can trust the data, understand the cause, and know what to do next.







“With Lightfield, I can find problems faster than other CRMs because I trust the information to be accurate. I’m building visibility into whether we have gaps in pipeline, if we’re not selling to the right people, and what types of leads are moving the fastest.”
Lightfield helps you understand your business and scenario plan with evidence.
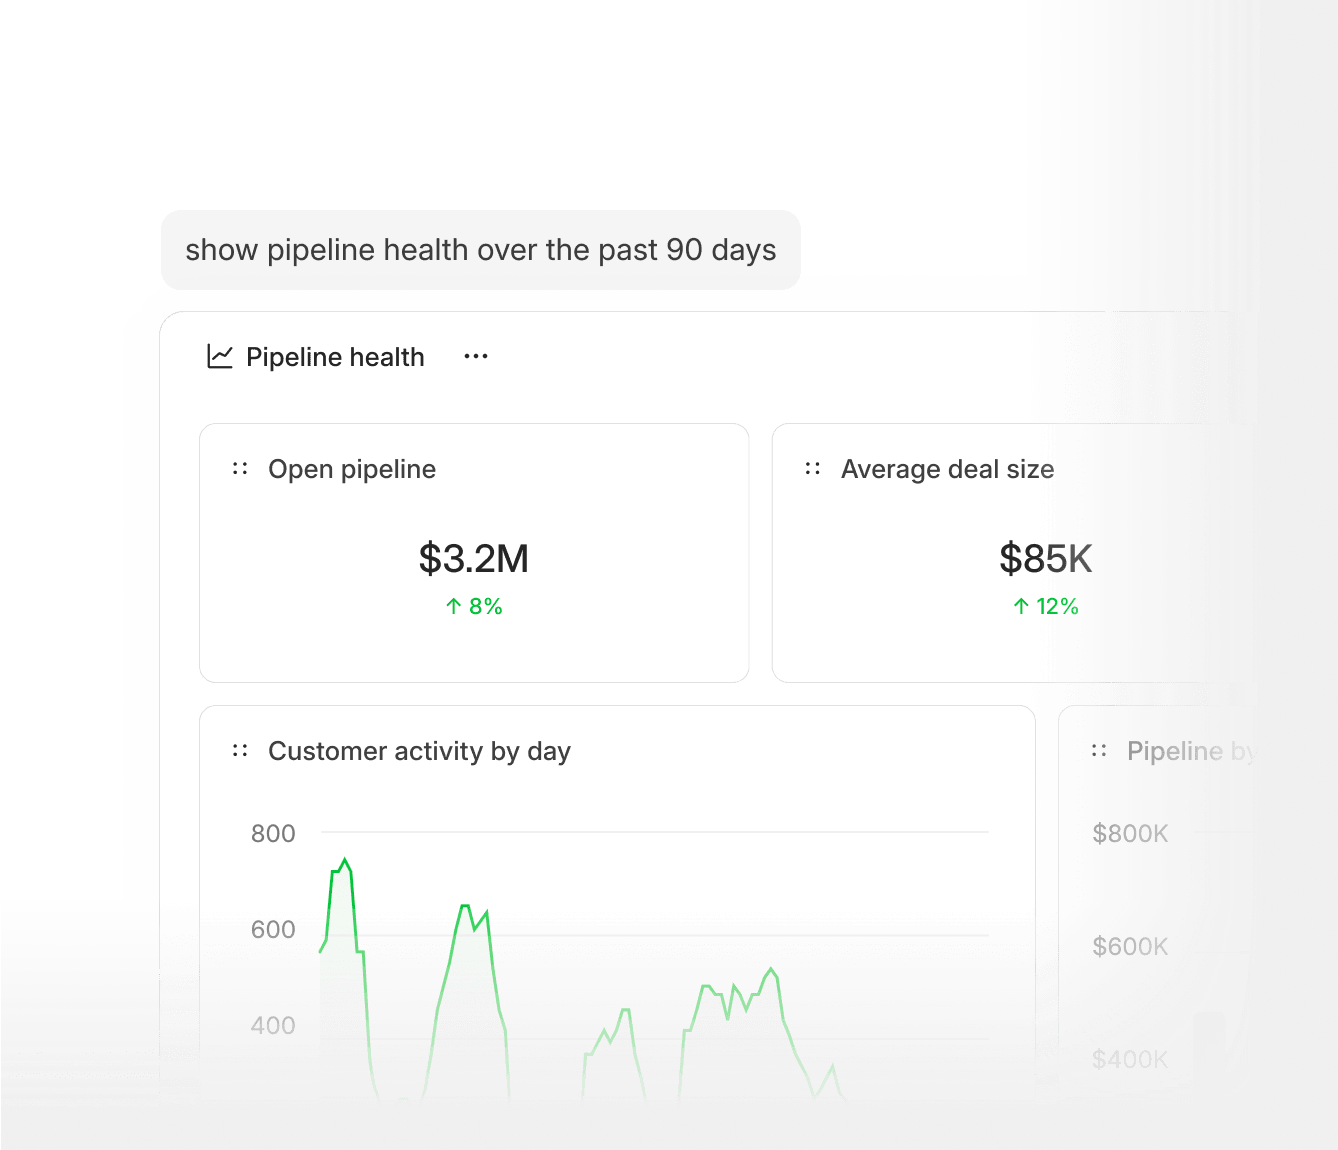
Build dashboards and reports with chat
Create charts and tables in seconds using prompts, and use them to track performance over time.
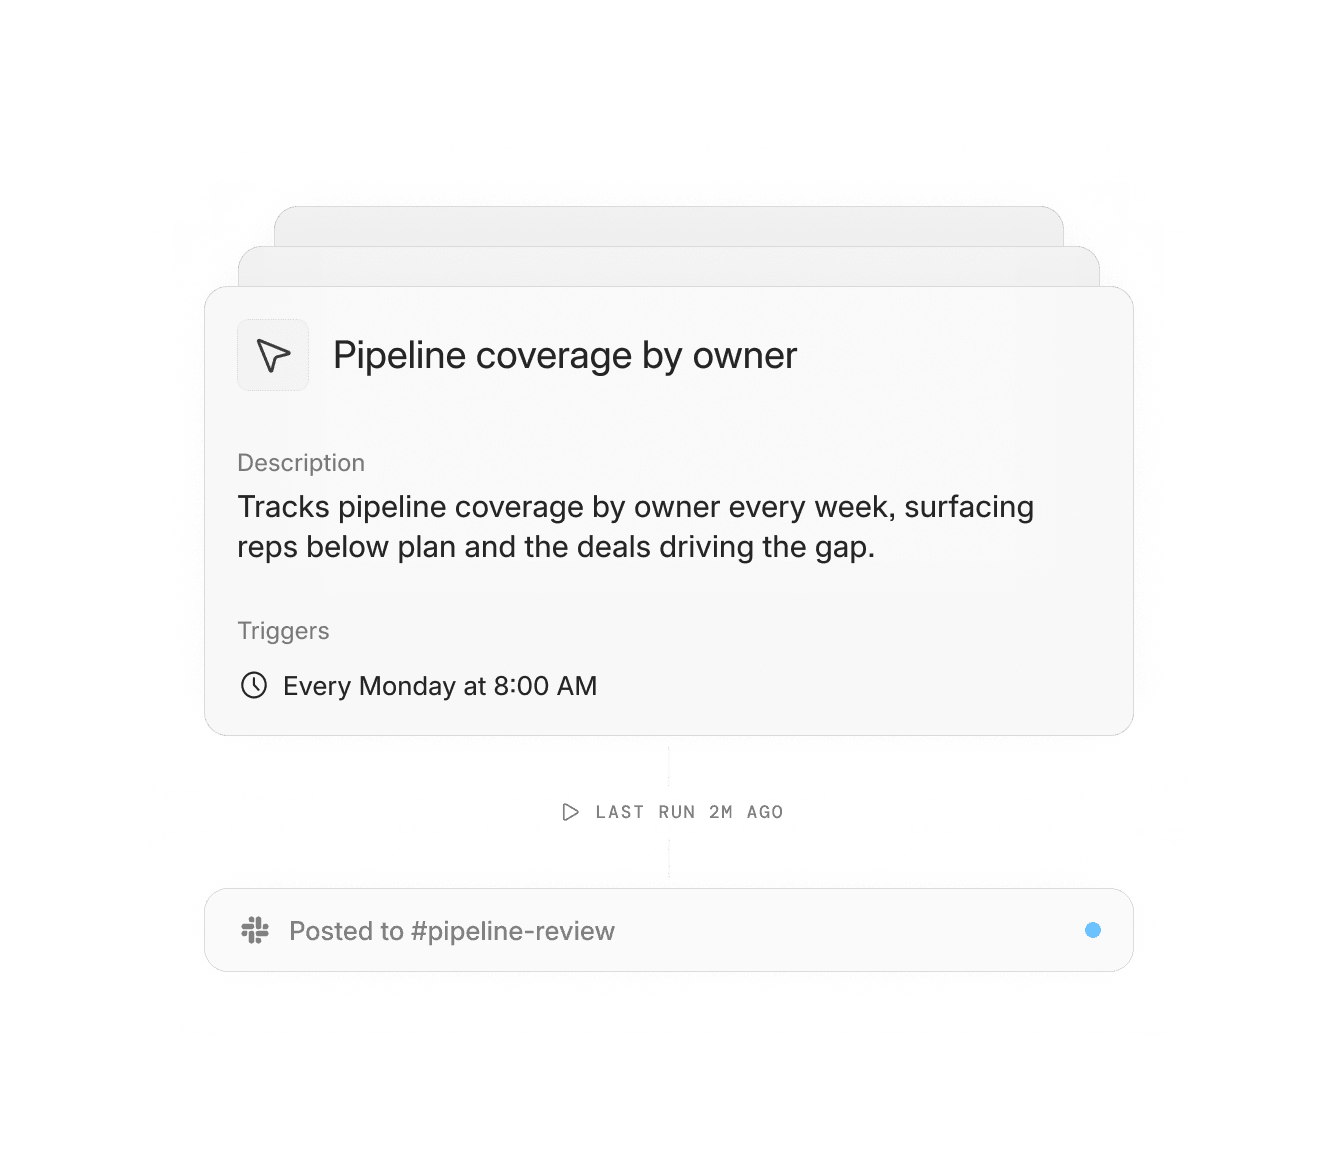
Automations for recurring reports
Turn recurring queries into automated reports that are delivered on schedule via Slack or email.
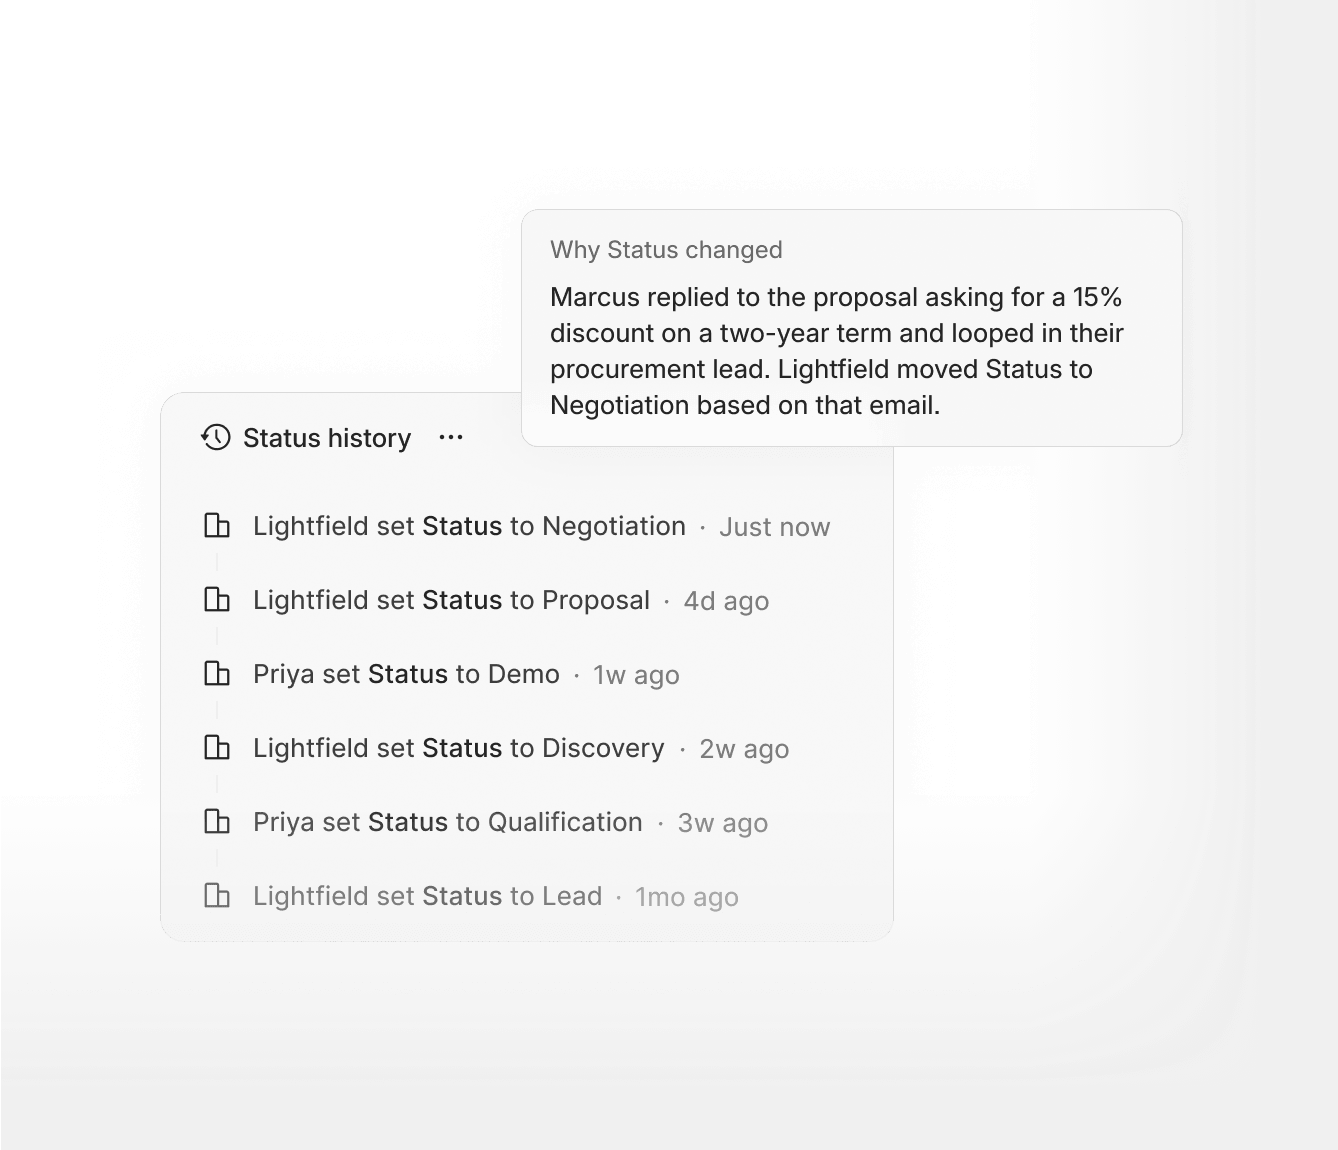
Versioned records and change tracking
Every field keeps its own history: previous values, who or what changed them, when they changed, and why.
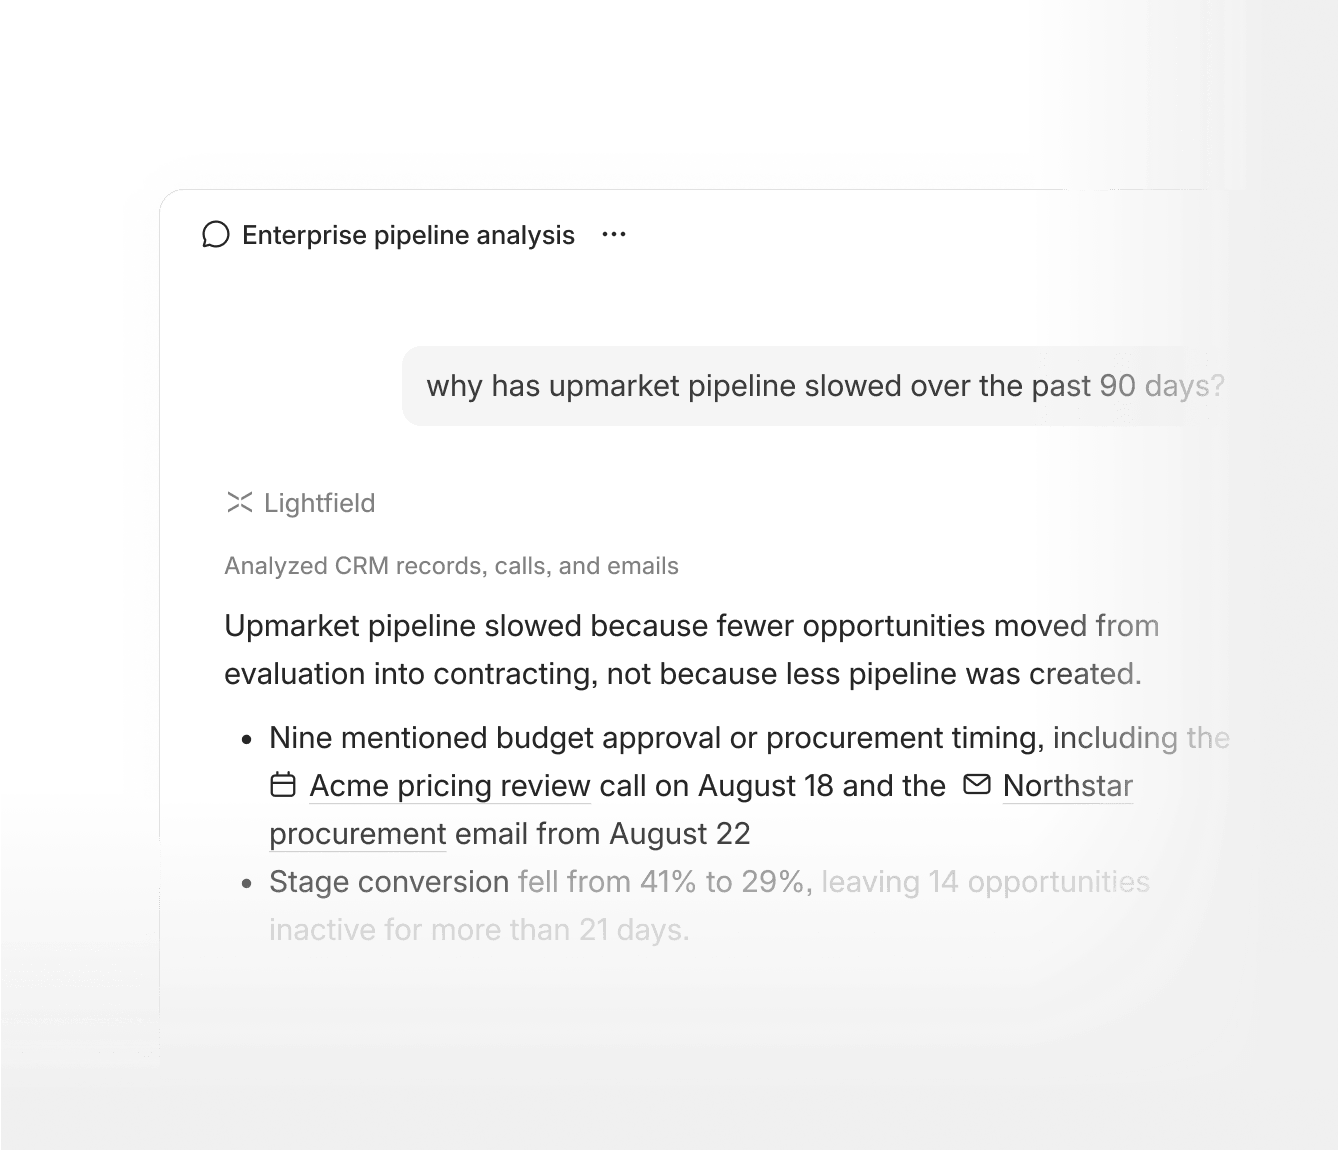
Answers backed by evidence
Ask why win rate dropped, why a segment stalled, or what buyers said about price. Answers link to the underlying calls and emails.
Projections and what-ifs
Ask what happens if close rates hold or a bottleneck clears. Projections run on the same evidence as your reports.

Common applications of Lightfield
Deals going quiet
A live list of late-stage deals with no activity in 14 days, each linked to its last call or email.
Win/loss by segment
A dashboard of win rates by segment, with loss reasons pulled from calls and emails.
Rep coaching
A table of coverage, cycle time, and win rate by rep, where every number opens the deals behind it.
Monday pipeline digest
A scheduled report of what changed in pipeline, posted to Slack every Monday before your review.
Quarter-end projection
A projected landing range for the quarter, built from stage conversion and the deals still open.
Test a hypothesis
A comparison of close rates across your own history, with the sample size stated.
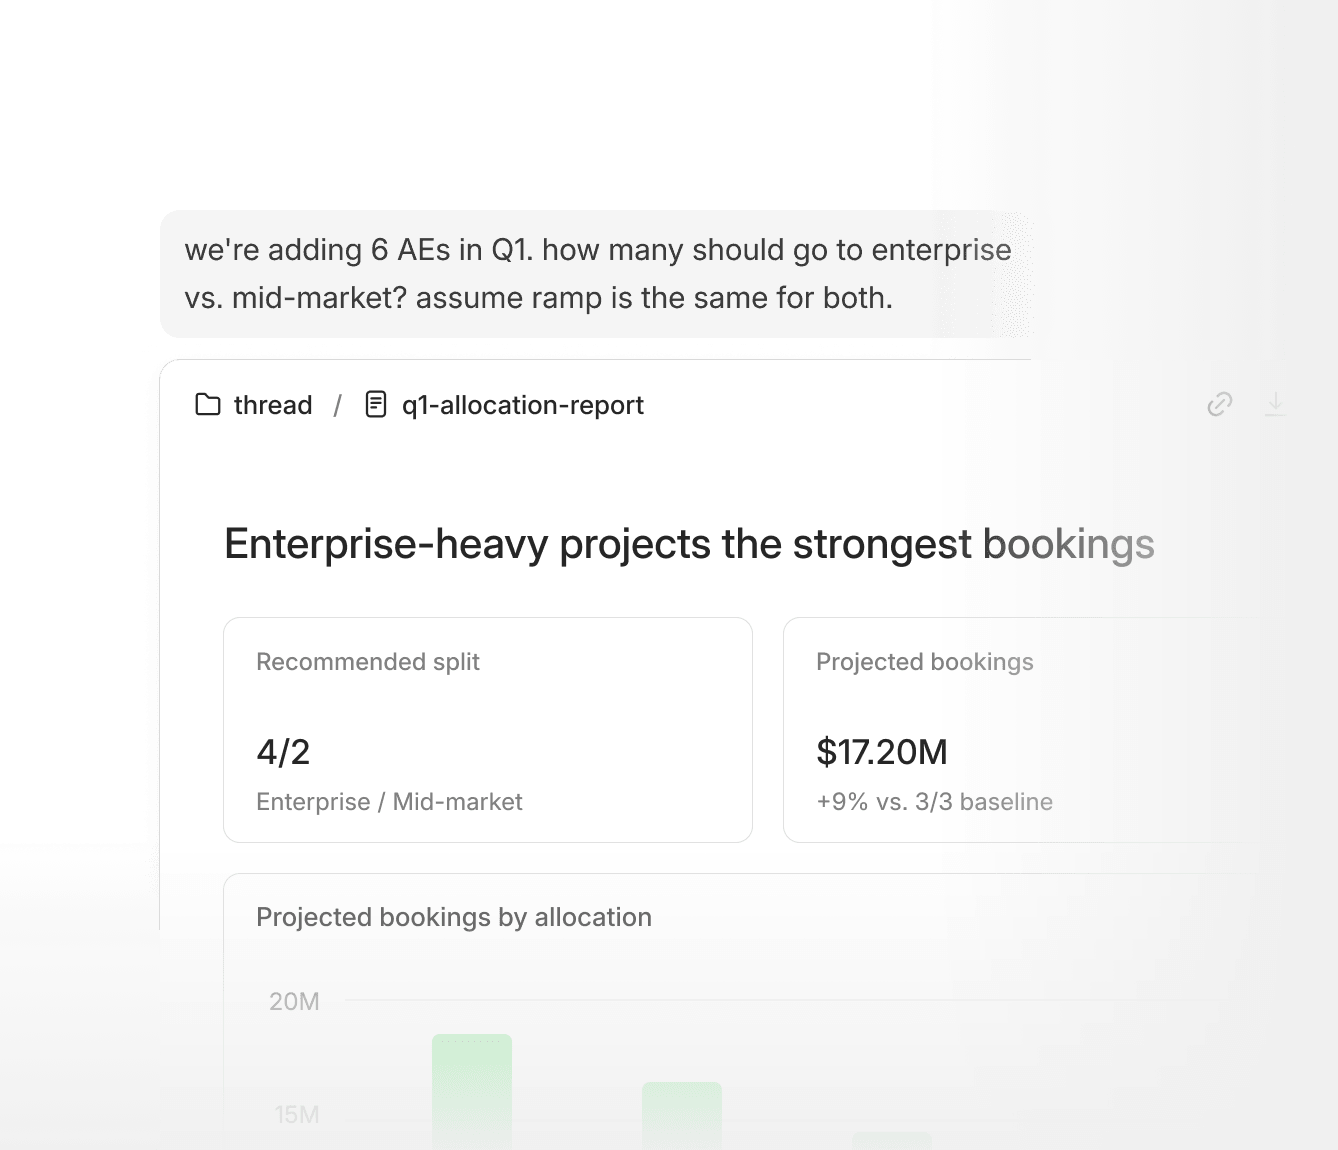
Headcount allocation
A decision model that scores every split against your pipeline and recommends a starting point.
Budget decision
A projection of pipeline created under each option, based on how each channel has converted before.
Built for trust
Sensitive data encrypted at rest, with TLS and role-based access.